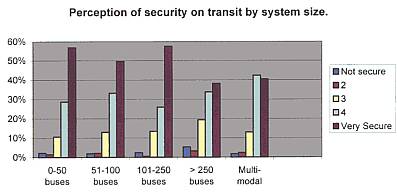
RESULTS AND ANALYSISThe following two charts illustrate how that perception of security breaks down by region and by system size.
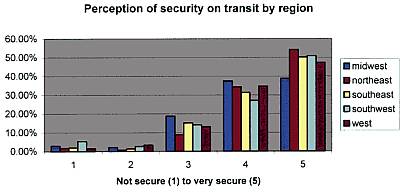
Results from these two graphs show that transit users’ perception of security are lower on systems with more than 250 buses and transit users’ perceptions in the Midwest are lower than in other parts of the country. The average percentage totals for feeling very secure fall from above 50% to below 40 % for multi modal transit agencies and those with more than 250 buses.
 |