by Daniel Brouse and Sidd Mukherjee
2022-2023
Most climate change models forecast rising sea levels as the predominant threat of a warming climate to flood risks. Though sea level rise is of great concern, so should be extreme rainfall (violent rain). One type of violent rain is an atmospheric river.
Atmospheric rivers are narrow bands of moisture that travel across the lower troposphere.
The Journal EOS in the article Atmospheric Rivers Spur High-Tide Floods on U.S. West Coast explains, "Atmospheric rivers, at their peak, can carry as much water through the sky as the Amazon River does on land. They unleash intense winds and heavy rain as they surge across the Pacific Ocean, eventually making landfall on the U.S. West Coast, contributing to many high-tide flooding events."
Both the sea and air temperatures are rising.
Warm air can hold more moisture than cool air. Warmer sea temperatures result in more evaporation. Warmer air can hold more moisture. The increased moisture in the air moves over land causing inland deluges.
Western North America / Pacific Northwest
Atmospheric rivers bring heavy rainfall inland causing extreme flooding. In October of 2021 NOAA said, "a convergence of storms brought more than half a foot of rain to parts of the Bay area in addition to strong winds, flash floods, and mud/landslides. They also bring the potential for heavy snow to higher elevations in the Sierra Nevada mountain range." (Atmospheric River Hits the West Coast)
In December 2022 and January 2023, California experienced nine back-to-back atmospheric rivers; the longest stretch of continuous atmospheric river conditions on record. NOAA went on to report, "Several atmospheric rivers struck in March 2023, bringing heavy rain and snowfall to much of the West. According to the California Department of Water Resources, the statewide snowpack was among the deepest ever recorded for the end of March -- 237% of normal."
East Coast Atmospheric Rivers
Historically in the United States, atmospheric rivers (AR) have been associated with the West Coast. Now, AR activity is getting more attention on the East Coast. "Actually, their frequency is not really increasing. Meteorologists have used the term for decades. It has simply become popular by the media. Just like polar vortex," said Jeff Boyne, National Weather Service meteorologist and climatologist. Indeed, "atmospheric rivers are more frequent on the East Coast than they are on the West Coast," said Jason Cordeira, associate professor of meteorology at Plymouth State University. "They're just not as impactful and don't usually produce as much rainfall."
What is changing is the research into the types and increasing intensity of East Coast AR events. "Between 1958 and 2012, the Northeast saw more than a 70% increase in the amount of rainfall measured during heavy precipitation events, more than in any other region in the United States. Projections indicate continuing increases in precipitation, especially in winter and spring and in northern parts of the region," as reported in The US Fourth National Climate Assessment.
Most types of East Coast ARs are increasing in intensity likely due to climate change. The study Identifying Eastern US Atmospheric River Types and Evaluating Historical Trends reports, "The impact of increasing moisture transport could be significant across the northeast corridor from Washington D.C. to Coastal Maine, as it increases the risk of extreme precipitation from landfalling ARs. The results indicate most ARs in the study domain are forced by extratropical cyclones, with lee side low pressure systems and coastal lows along the Atlantic Coast (e.g. nor'easters) responsible for producing the strongest ARs."
Greenland Atmospheric Rivers
Atmospheric rivers have been putting serious rainfall melt on Greenland for the last decade, too.
Darker snow surfaces absorb more sunlight and melt quicker. This effect is visible in Greenland. Box et al.,"Greenland ice sheet albedo feedback: thermodynamics and atmospheric drivers," The Cryosphere, v6, pp821 et seq., doi:10.5194/tc-6-821-2012 state: " Thus, intraseasonal summer albedo variability exceeds 0.50 over parts of the ice sheet where a snow layer ablates by mid-summer, exposing an impurity-rich ice surface..." Prof. Box is now investigating soot from North American wildfires as a factor in the darkening of Greenland.
-- from News from the Ice Wars:An Occasional Bulletin
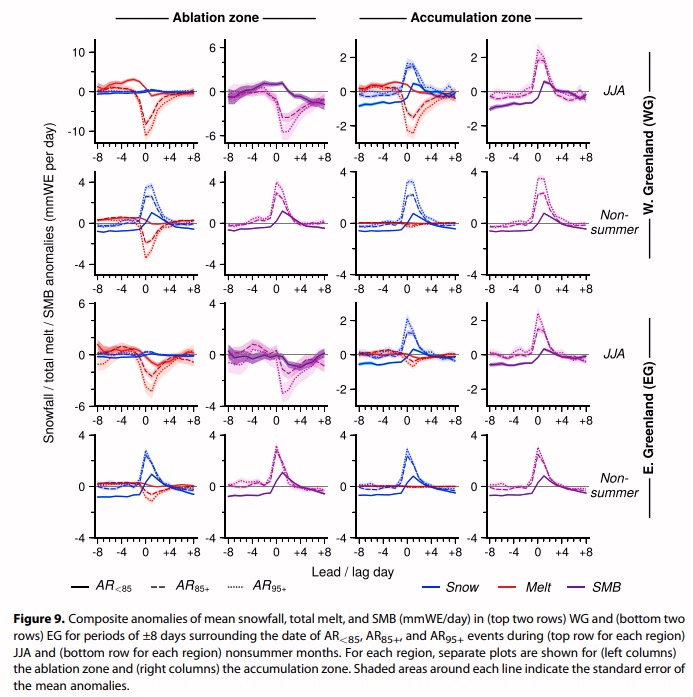
"Furthermore, our investigation of the short- and long-term relationships between moisture transport vents and modeled GrIS surface properties proves that this correspondence between the years of enhanced AR activity and anomalous GrIS mass loss is not a coincidence. Strong AR impacts cause increased melt in all areas of the GrIS and decreased SMB in the ablation zone during summer, and warm seasons with above-average GrIS melt extent are characterized by anomalously strong moisture transport by ARs over Greenland. ARs typically result in SMB gains in the GrIS ablation zone during nonsummer seasons and in the accumulation zone during all seasons. However, the intense summer SMB losses in the ablation zone during years of enhanced moisture transport outweigh the positive AR contributions to SMB in other regions and seasons. The scaling of melt versus snowfall in Figures 9 (right) and 11 shows that the magnitude of mass loss from summer melt in the ablation zone has a much greater upper limit than mass gain from snowfall."
Then in 2018, Neff publishes again: more on atmospheric rivers causing the full surface melt in greenland in 2012.
-- from Atmospheric River Impacts on Greenland Ice Sheet SurfaceMass Balance
"Rainfall at the Greenland ice sheet Summit 14 August 2021, was delivered by an atmospheric river (AR). Extreme surface ablation expanded the all-Greenland bare ice area to near-record-high with snowline climbing up to 788 +/- 90 m. Ice sheet wet snow extent reached 46%, a record high for the 15-31 August AMSR data since 2003. Heat-driven firn deflation averaged 0.14 +/- 0.05 m at four accumulation area automatic weather stations (AWSs). Energy budget calculations from AWS data indicate that surface heating from rainfall is much smaller than from either the sensible, latent, net-longwave or solar energy fluxes. "
"Rainfall heat transfer contributed just 2% to the calculated melting at a 2,200 m elevation western ice sheet site (CP1 a.k.a. Crawford Point). Condensation or sensible heat transfer from the warm air mass was a far more powerful heat source. The observed amount of melting delivered by the AR could have happened without rain- fall. Yet, the impacts of rain and meltwater refreeze are considerable provided that percolation delivers the melt below where the heat can be radiated away and that refreeze-at-depth occurs. We found no evidence for the latter condition because the rainfall amount was not extreme and the surface was already melting hours before the rain- fall. Understanding any changes to the frequency and intensity of ARs appears to be a more important research target than the heat content of the liquid precipitation ARs may or may not produce Further, while rainfall that does not percolate and refreeze may not have strong surface thermodynamic impacts, rainfall contribution to the hydraulics of Greenland ice (Doyle et al., 2015) may be more consequential to ablation through ice sheet flow acceleration."
Open access, read all about it. The Watson river discharge described in the paper drains the saddle between north and south domes and is an area that I watch closely for signs of collapse. I suppose this is one.
-- from Greenland Ice Sheet Rainfall, Heat and Albedo Feedback Impacts From the Mid-August 2021 Atmospheric River
Does the rainfall have a significant impact? Yes; however, it is the
Albedo Feedback that is of the most concern.
"It turns out that the rain itself wasn't the most important factor," says Prof. Jason Box from GEUS and lead author of the paper. "There is an irony. It's not really the rain that did the damage to the snow and ice, it's the darkening effect of the meltwater
and how the heat from the event erased snow that had overlaid darker ice across the lower third of the ice sheet."
How Fast Are Atmospheric Rivers Gaining Intensity?
Some areas of the world are now warming so fast, it is becoming more difficult to measure the change from "normal" or average. Jeff Boyne of the NWS said,
"There are climate normals that are updated every 10 to 15 years, because the planet is warming so fast. The ENSO (El Nino-Southern Oscillation) regions are warming so fast that those normals are being updated every 5 years." Overall, how fast is climate change accelerating? Rapidly.
"It's so far outside anything we've seen, it's almost mind-blowing," says Walter Meier, who monitors sea-ice with the National Snow and Ice Data Center.
"September was, in my professional opinion as a climate scientist, absolutely gobsmackingly bananas," said Zeke Hausfather, at the Berkeley Earth climate data project."
ALSO SEE:
How is All Real Estate at Risk From Climate Change? Brouse and Mukherjee (2024)
Flood Insurance Brouse and Mukherjee (1995-present)
The Reign of Violent Rain Brouse and Mukherjee (2023)
East Coast Atmospheric Rivers and AMOC (Atlantic Meridional Overturning Circulation) Brouse (2024)
Climate Change, the Jet Stream, and East Coast Atmospheric Rivers Brouse (2024)
The Age of Loss and Damage Brouse (2023)
Climate Change Impacts on Flood Risks and Real Estate Values Sidd Mukherjee and Daniel Brouse (2023)